In this blog post, we will detail the process of using Hixloop to speed up the generation of a labeled dataset.
Hixloop Introduction
Hixloop offers users a seamless data labeling workflow. Commencing with data importation, users initiate the labeling process by annotating a small segment of their dataset. This initial input serves as the foundation for training the first AI model. Utilizing this model, predictions are generated for the remaining data.
Human verification of these predictions follows, ensuring accuracy and reliability. Subsequently, a new model is trained, incorporating human-verified predictions to enhance precision.
Labeled Dataset Creation
The Base Dataset
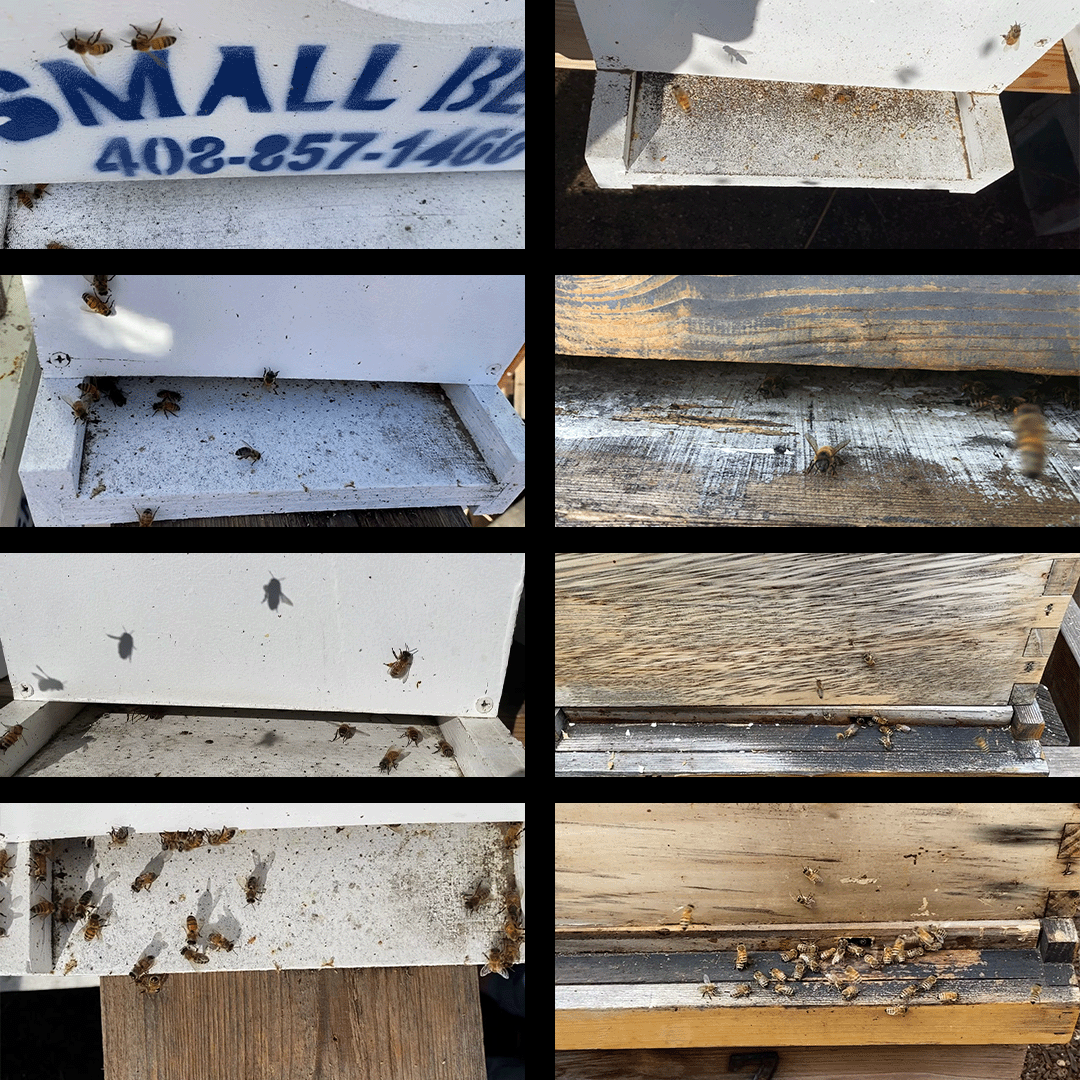
The dataset contains around 3000 images featuring bees and hives, with the following specifications:
- RGB images (24-bit)
- Varied image sizes, including 4K, 1080p, and 720p.
- Approximately 20 different points of view.
The dataset can be downloaded here:
https://www.kaggle.com/dsv/4738309Credit:
 @misc{andrewl_2022,
	title={Bee Image Object Detection},
	url={https://www.kaggle.com/dsv/4738309},
	DOI={10.34740/KAGGLE/DSV/4738309},
	publisher={Kaggle},
	author={AndrewL},
	year={2022}
}
Dataset Preview
The Task / What we want to solve
Find and count bees in images.
Labelling Project Creation
For labeling tasks, Hixloop utilizes Label Studio, a widely recognized open-source labeling interface.Let's begin by establishing a project to label bounding boxes on bee images.
First Loop
Labelling Data for the first Loop.
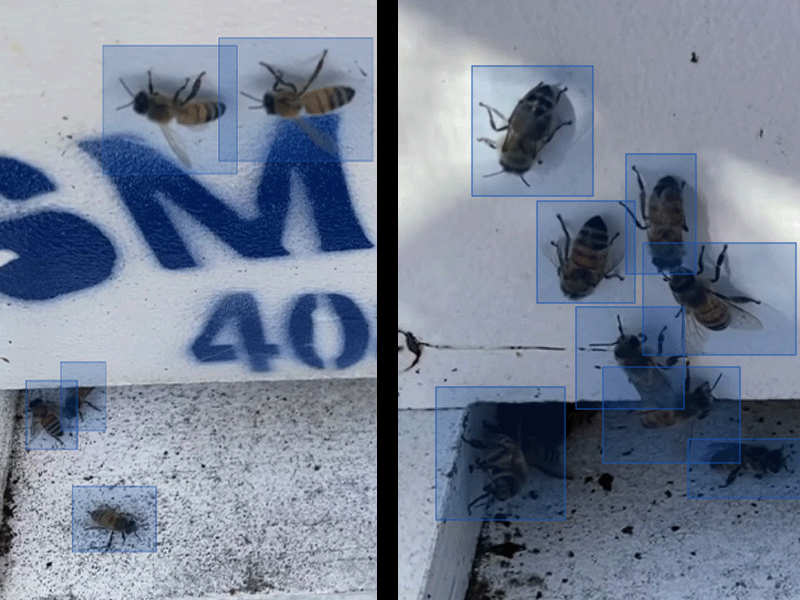
In the initial loop, we labeled 28 images, capturing all the bees within each image. We deliberately selected various backgrounds to enhance the impact of each image during the training process.
The labeling process took approximately 20 minutes.
Training the first Loop
We randomly divided the initial dataset of 28 images into groups for training and validation purposes.
- Training Set: 233 bees
- Validation Set: 43 bees
The trained model is a Faster R-CNN, but we won't delve into further details as that is not the focus of this blog post.
Result of the First Loop
After the training, predictions were generated for all images imported into the project. Initial results are promising, capturing the majority of bees in the simplest images. However, in cases with significant overlap, the model's performance is not optimal.
Evaluate the first Model
To evaluate the model, we calculate the average recall and precision for various Intersection over Union (IoU) thresholds and box sizes. The evaluation is conducted on a distinct set of images that have never been presented to the model.
Here are the results:
In regards to the results obtained from the test dataset:
- The average precision is 0.321, meaning that 32% of the proposed model boxes are correct.
- The average recall is 0.222, indicating that 22% of the boxes are identified.

The results indicate that the model is currently not performing well, even though it can provide predictions for simpler images.
Expanding the Dataset Size with First Loop Predictions.
Utilizing the predictions from the first loop allows us to quickly acquire additional labels through review.
This method yields 72 new images in less than 5 minutes, bringing the total number of images to 100.
Although we initially imported 2000 images into the dataset, we chose to conclude loop 2 with 100 images.
Using predictions to obtain labels has significantly simplified and accelerated the task compared to manual labeling, making it notably easier and faster.
Depending on the accuracy of the image and the model, we can estimate a speed-up factor ranging between 5 and 10.
After doing the same splitting process we get:
- 614 bees in the training set
- 170 bees in the validation set.
Second Loop
Training the Second Loop
We opted to extend the training of the same model.
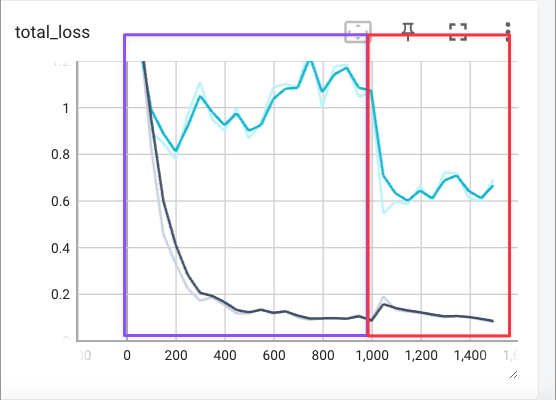
As illustrated in the graph, the purple box represents the training of the first loop, which plateaus after 200 epochs and begins to overfit.
The addition of these 72 images results in a loss reduction to 0.6 in the second loop (red box).
Regarding the results on the test dataset, we achieved an average precision of 0.43 and an average recall of 0.298. While not a substantial improvement, these metrics indicate that the model is still learning and improving on our test dataset (ground truth).

Training a new model using predictions from prior loops.
Following loop 2, we doubled the labeled images in our dataset:
- Training Set: 1218 bees
- Validation Set: 276 bees
We can now train a new model with the same structure (Faster R-CNN) but with a consistent number of labels.
Final Results
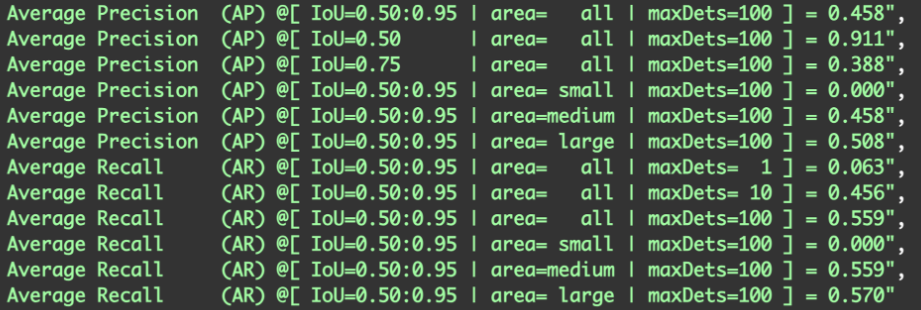
After three loops, the scores reached 0.91 (was 0.43) for average precision and 0.56 (was 0.29) for average recall. While not perfect, the model now needs to learn how to detect overlapped bees, a task that can be easily addressed with Hixloop by correcting errors in the predictions.
Next Steps
There are several next steps ahead. We can further utilize Hixloop to label more images. Currently, we've only incorporated ~200 images (1218 bees), which is a fraction of the 3000 images in the dataset.
Expanding the task to a more intricate level could be determining whether a bee is entering or exiting the hive. This task could address the question: "What is the flux of bees in and out of my hive?"


